Introduction
Type 1 diabetes (T1D) is a lifelong autoimmune disease characterized by absolute insulin dependence and substantial glycemic variability. Despite advances in diabetes technology, achieving stable metabolic control remains challenging for many individuals, as glycemic outcomes are influenced by multiple factors, including psychological stress, physical activity, menstrual-cycle-related hormonal changes, and overweight or obesity. Global modeling data suggest that the prevalence of T1D will continue to increase in the coming decades.1
In recent years, continuous glucose monitoring (CGM) has become established as an important complementary tool to HbA1c for assessing glycemic control in individuals with T1D and is now recommended in current clinical guidelines.2–4 Both methods have specific advantages and limitations.
HbA1c reflects mean glycemia over the preceding 2–3 months, but does not capture short-term glycemic variability, hypoglycemia, or time spent within specific glucose ranges.5
HbA1c currently represents the best validated surrogate marker for estimating the risk of diabetes-related long-term complications.5,6 However, it does not capture short-term glucose fluctuations or glycemic variability.
CGM continuously measures glucose concentrations in the interstitial fluid using a subcutaneous sensor that records glucose values at short intervals. Due to measurement in the interstitial compartment, CGM values show a slight delay compared with capillary blood glucose measurements.2 In clinical practice, CGM data are commonly analyzed over approximately 14 days, and this duration has been shown to provide a reasonable estimate of several 90-day glucose metrics.7 However, more recent evidence indicates that 14-day sampling can be insufficient for some metrics and may introduce clinically relevant individual-level bias when used to represent longer-term glycemic exposure.8 Longer sampling periods can improve classification of glycemic targets; for hypoglycemia metrics and glycemic variability, approximately 21–35 days may be required, depending on the specific metric.9 In research settings, reduced monitoring duration may also decrease precision or attenuate associations in downstream analyses; a recent study therefore recommended at least 30 days of CGM data with ≥70% completeness for study protocols when feasible.10 Accordingly, longer assessment periods may provide a more robust representation of longer-term glycemic control, particularly when hypoglycemia or glycemic variability are of interest.8–10 In contrast to HbA1c, CGM provides a detailed representation of glucose profiles, including short-term trends, glycemic variability, and the frequency of hypo- and hyperglycemia. Important CGM metrics include time in range (TIR), time above range (TAR), time below range (TBR), and glycemic variability, commonly expressed as the coefficient of variation (CV). International consensus recommendations have defined specific target values for these parameters, which are presented in Table 1.3,4
These CGM-derived metrics are particularly relevant for evaluating HCLS therapy, as CGM data are both the basis for automated insulin delivery and central outcome measures of glycemic control. Clinical benefits of CGM use in individuals with diabetes have been demonstrated in numerous studies.11–14 However, gaps in data collection or other technical and user-related factors may limit data interpretation. In addition, CGM data can be used to calculate the glucose management indicator (GMI), which provides an HbA1c-like estimate derived from mean CGM glucose values during the observation period. The combined assessment of HbA1c and CGM-derived metrics provides a more comprehensive evaluation of glycemic control than either method alone, as both elevated HbA1c levels and reduced TIR are associated with an increased risk of acute and long-term diabetes-related complications.4,15
An exploratory, unpublished four-component score provided by Prof. Roger Lehmann (personal communication, 30 July 2026) was used to summarize glycemic control in the CGM subgroup. The scoring criteria and descriptive results are presented in Supplementary Tables S1 and S2. Higher scores indicate better glycemic control; the score has not been externally validated.
In parallel with the increasing use of CGM, automated insulin delivery (AID) systems have been progressively incorporated into clinical practice in recent years. AID systems consist of three main components: a CGM device, an insulin pump for continuous insulin delivery, and an algorithm that automatically adjusts insulin administration based on measured glucose values. This enables real-time glucose-responsive feedback and dynamic insulin delivery adjustments. The most widely used AID systems are hybrid closed-loop systems (HCLS), in which insulin delivery is automatically adjusted according to CGM values. However, meal boluses and adjustments in specific situations, such as physical activity or illness, still require active patient involvement. The term “hybrid” therefore reflects the continued need for patient participation compared with fully closed-loop systems. Randomized controlled trials have consistently demonstrated that HCLS reduce HbA1c and substantially increase time in range compared with conventional pump therapy or CGM-assisted insulin dosing, without increasing hypoglycemia rates.16–19 These findings have been confirmed by meta-analyses across different age groups and baseline characteristics.20–22 Real-world studies have further shown that these benefits are also observed in routine clinical practice.23–25
The aim of this retrospective study was to evaluate the impact of the four hybrid closed-loop systems available in Switzerland between 2019 and 2024 on glycemic control in adults with type 1 diabetes under real-world conditions. HbA1c and CGM-derived parameters were analyzed before and after transition to HCLS. The exploratory score was analyzed descriptively in the CGM subgroup.
Methods
Baseline data and data collection
Between June 2019 and September 2024, 124 of the 598 patients with type 1 diabetes (20.7%) treated at Institute DiaMon during this period were transitioned to HCLS available in Switzerland. The main reasons for transition included suboptimal glycemic control or, in patients with already satisfactory glycemic control, a desire to further optimize therapy.
HbA1c values were retrospectively analyzed for all patients using measurements obtained 0–6 months before and 2–6 months after transition to HCLS. In addition, CGM data were included in the analysis based on a single 14-day assessment period.
Exclusion criteria included an HbA1c >11% (n=2), missing HbA1c measurements within the predefined period before (n=7) or after (n=4) transition to HCLS, and insufficient device use, defined as less than two-thirds of available CGM data over a 14-day period (n=4). In total, 17 of the 124 patients were excluded from the analysis.
After applying the exclusion criteria, 107 patients remained eligible for analysis. All HCLS available in Switzerland between 2019 and 2024 were represented in this cohort. An overview of the four systems is provided in Table 2. The choice of the respective system was made jointly by patients, diabetes educators, and diabetologists at Institute DiaMon, taking into account the specific advantages and disadvantages of each system, which are also summarized in Table 2. The distribution of the systems was as follows: CFX (n=31), Medtronic (n=28), DBLG1 (n=26), and Control-IQ (n=22).
Training provided by diabetes educators lasted between 2 and 4 hours and typically comprised one to three sessions. Following transition and until the first HbA1c assessment, patients attended one to three follow-up visits with the interdisciplinary diabetes team (diabetologist, dietitian, and diabetes educator). The educational content reflected contemporary standards of diabetes technology management and was consistent with the recommendations subsequently published by the Swiss Society of Endocrinology and Diabetology (SGED) in 2025.3 During follow-up, individualized adjustments of algorithms and basal rates were performed, and structured education was provided on optimal system use, including nutrition and management in special situations such as physical activity and illness. The therapeutic goal was to achieve an HbA1c <7% and/or recommended CGM targets presented in Table 1.
Before transitioning to HCLS, 80 patients (75%) were treated with insulin pump therapy, while 27 patients used multiple daily insulin injections. A total of 105 patients were already using CGM systems, whereas two relied exclusively on capillary blood glucose measurements. At transition and throughout the study, no patients received an SGLT2 inhibitor or a GLP-1 receptor agonist. Baseline characteristics are presented in Table 3.
HbA1c and CGM data were available for analysis in 61 patients (57%). In the remaining 46 patients (43%), paired pre- and post-transition CGM data were unavailable due to missing data storage (n=30), insufficient data volume resulting from incomplete CGM recordings (n=14), or exclusive reliance on capillary blood glucose measurements before transition (n=2). Thus, complete pre- and post-transition CGM data were available for all 61 patients included in the CGM analysis.
HbA1c measurements were performed using the Atellica DCA HbA1c Dx assay (Siemens Healthineers), based on a latex agglutination inhibition assay. The measurement range was 4.0% to 14.0% NGSP (20–130 mmol/mol), with a coefficient of variation of 2.2%.
Statistical analysis
The analyzed variables included HbA1c and CGM-derived parameters. The unpublished four-component score was assessed as an exploratory descriptive outcome only (Supplementary Tables S1 and S2).
For further analyses, subgroups were defined according to eight demographic and clinical baseline characteristics (baseline subgroups). These included sex (male/female), age (<30, 31–39, 40–49, 50–59, and ≥60 years), body mass index (<25, 25–30, and >30 kg/m2), diabetes duration (<11, 11–20, 21–30, and ≥31 years), prior insulin pump therapy before transition to HCLS (yes/no), the presence of diabetes-related complications (at least one microvascular or macrovascular complication versus none), previous hypoglycemic or ketoacidosis events requiring hospitalization before transition (at least one event versus none), and the specific HCLS system used.
For all variables, the difference before and after transition (Δ = post − pre) was calculated both in absolute and relative terms. Absolute changes are presented as mean ± standard deviation (SD) and the minimum to maximum are indicated. The ΔHbA1c was compared across the different baseline subgroups.
In addition, three HbA1c response categories were defined: “improved,” “worsened,” and “no change.” A “no change” response was defined as a post-transition HbA1c value remaining within the assay coefficient of variation of ± 2.2% of the baseline HbA1c value. An “improved” or “worsened” response was defined as a post-transition HbA1c value below or above this range, respectively.
Furthermore, the influence of baseline HbA1c (<7%, 7–8%, >8%) on HbA1c changes (Δ) and response categories was analyzed.
Variables were analyzed as paired measurements (pre versus post HCLS). The distribution of paired differences was assessed by visual inspection of Q–Q plots. Variables with approximately normally distributed differences were analyzed using paired t-tests, while variables with non-normal distributions were analyzed using Wilcoxon signed-rank tests. P-values from all tests were adjusted for multiple comparisons using the Benjamini–Hochberg procedure to control the false discovery rate.
Associations between baseline subgroups and post-transition HbA1c were analyzed using ANCOVA, adjusting simultaneously for pre-transition HbA1c and eight demographic and clinical baseline characteristics. Model assumptions were evaluated by residual Q–Q and residual-versus-fitted plots. Multicollinearity was assessed with generalized variance inflation factors (GVIFs) to account for the four-level HCLS factor; all VIFs were below 2.6 and the highest adjusted GVIF was 1.58. Separate models for each characteristic, each adjusted for baseline HbA1c, were fitted as sensitivity analyses. In the CGM subgroup, the full model had 49 residual degrees of freedom. A p-value <0.05 was considered statistically significant.
Results
The paired differences were approximately normally distributed for most variables, except TBR low, TBR very low, TAR very high, and the exploratory four-component score.
No patient received an SGLT2 inhibitor or GLP-1 receptor agonist at transition or during follow-up. Seventeen patients had experienced DKA at some point since diagnosis before transition (mean diabetes duration 22.7 ± 11.9 years; range 1–53), while one patient experienced DKA within up to one year after transition. These proportions represent different observation periods and should not be interpreted as comparative incidence rates.
a) HbA1c outcomes in the total cohort
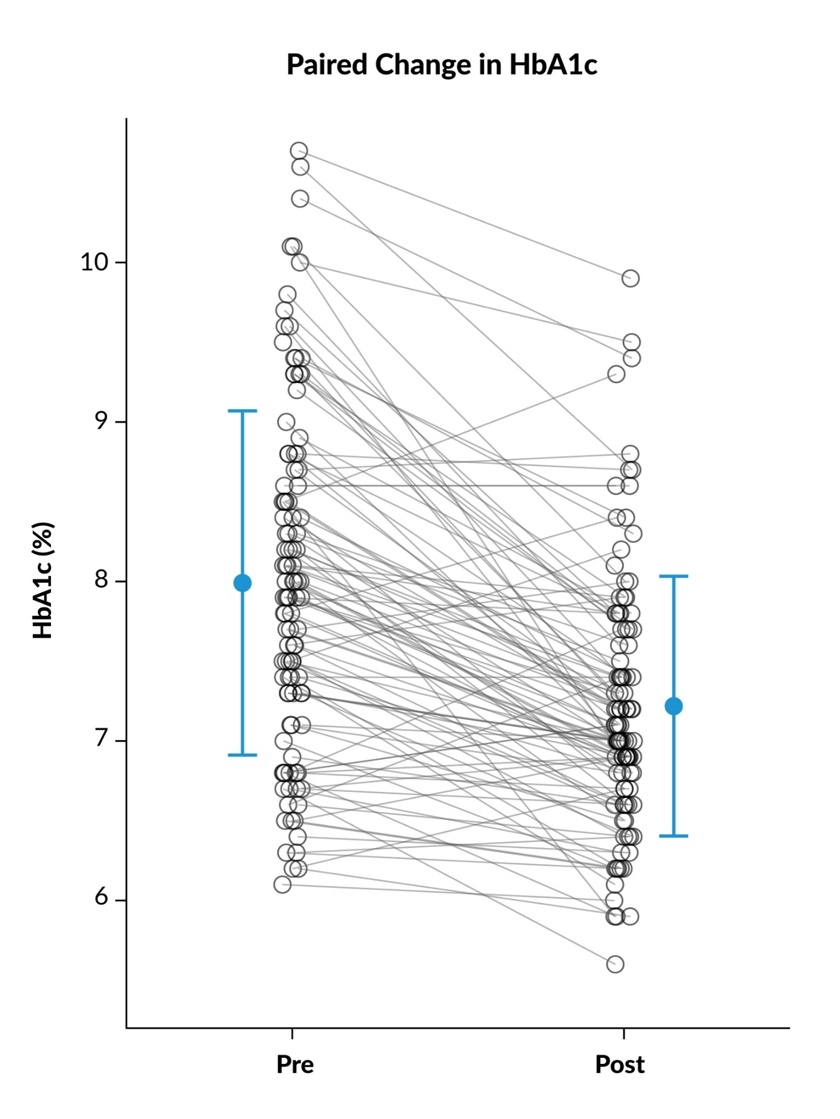
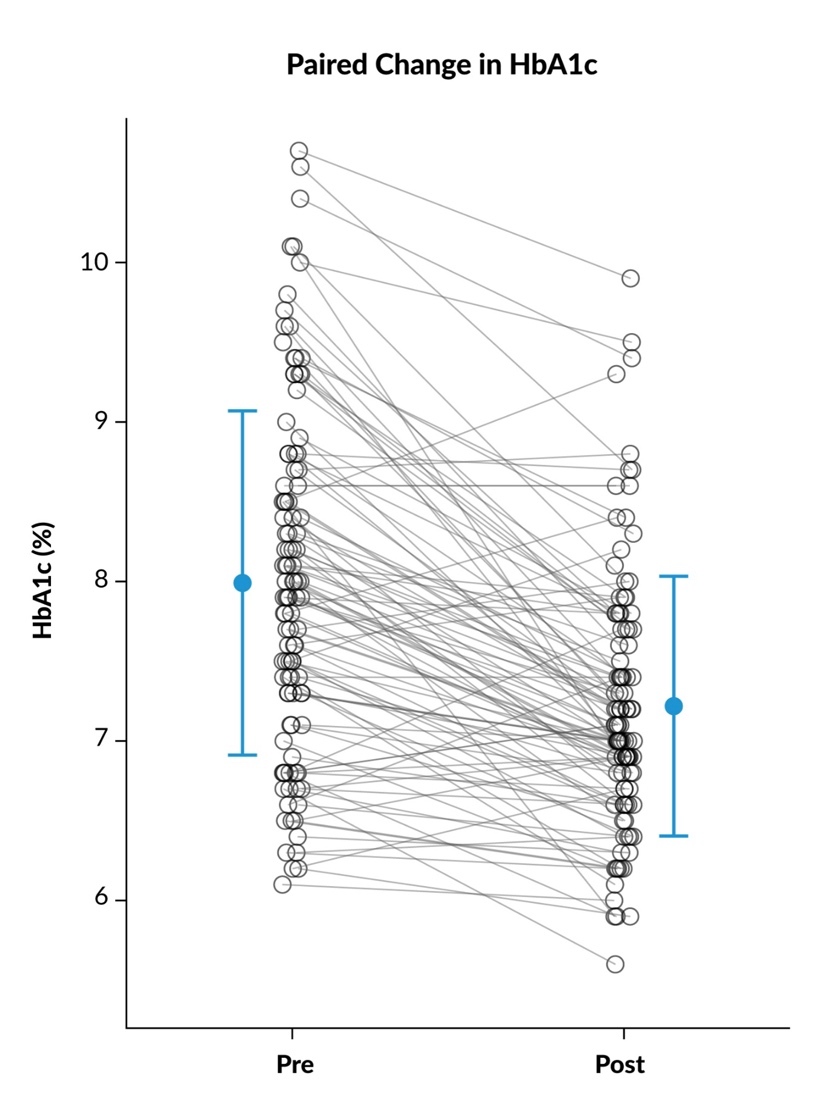
Individual HbA1c values before and after transition are shown in Figure 1. Following transition to HCLS, a highly significant improvement in HbA1c was observed (p<0.00005), decreasing from 8.0 ± 1.1% (range 6.1–10.7%) to 7.2 ± 0.8% (range 5.6–9.9%).
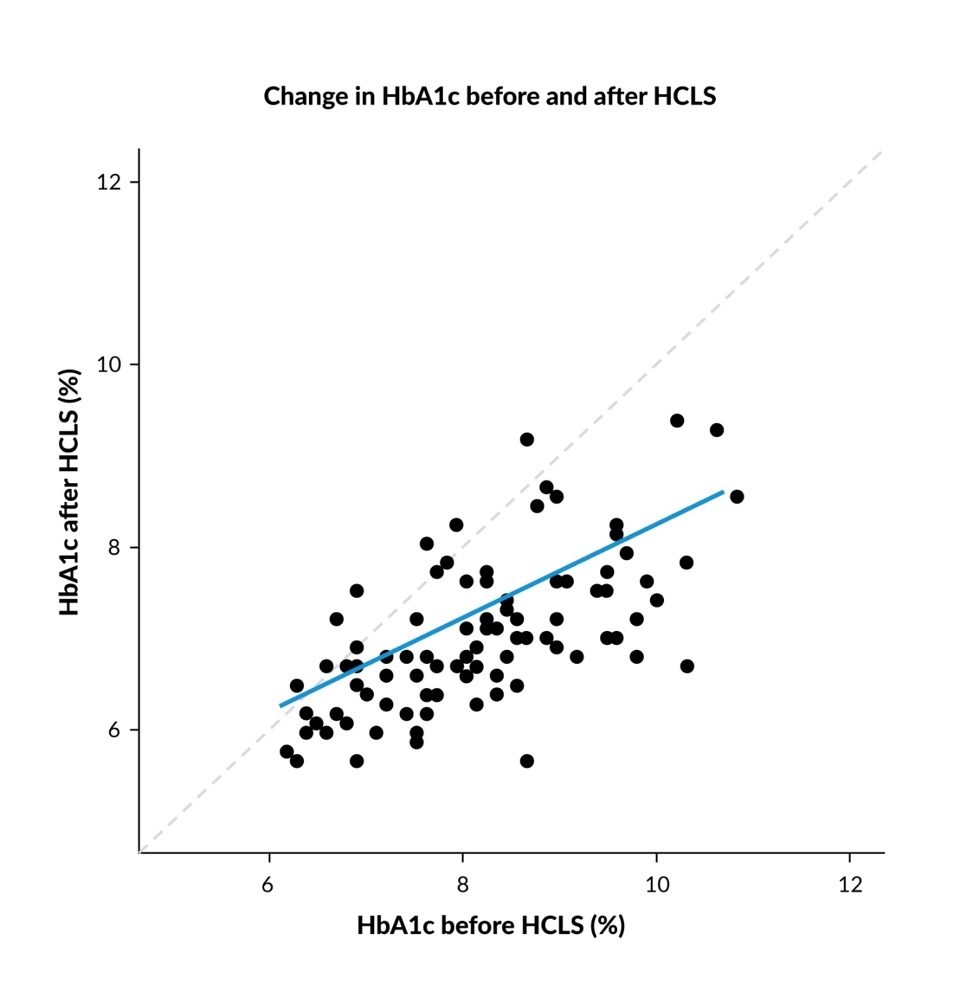
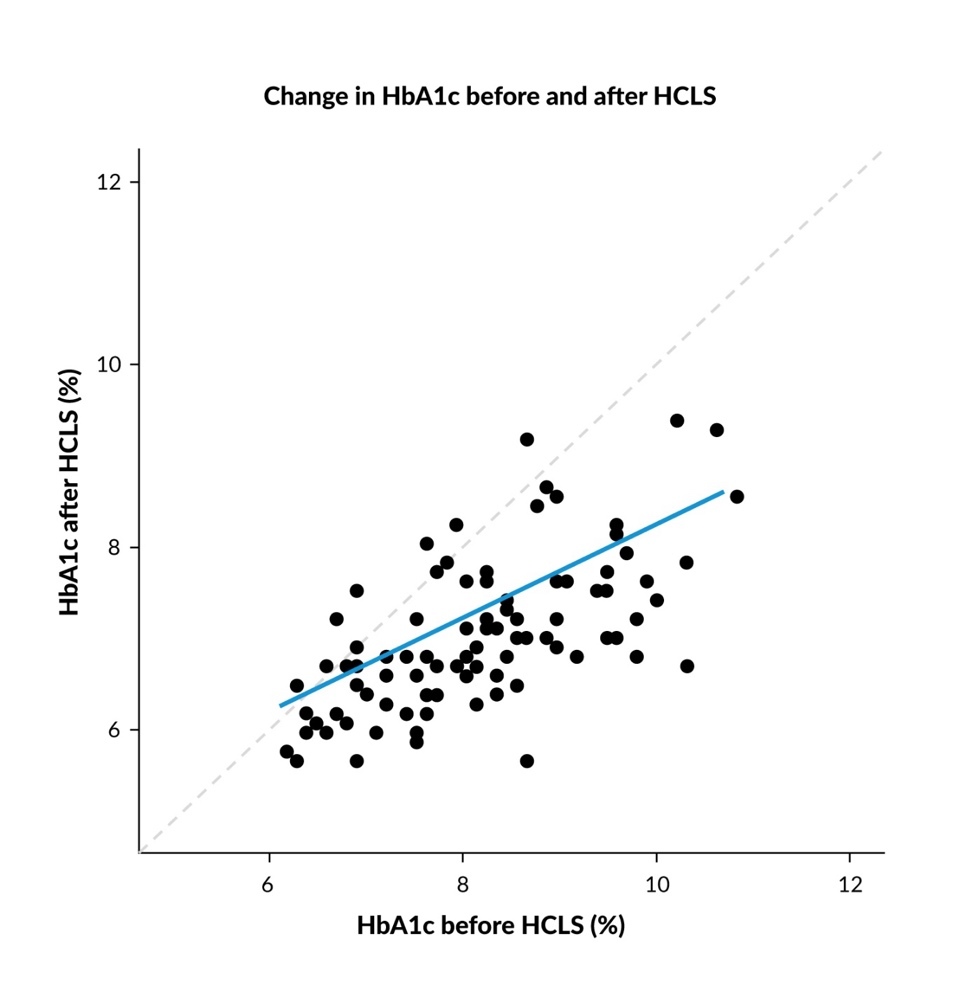
The linear regression analysis between pre- and post-transition HbA1c values is shown in Figure 2 and demonstrated a significant correlation (r=0.68 [95% CI: 0.56–0.77]).
Overall, 81 of 107 patients (76%) showed an improved HbA1c response, 14 patients (13%) showed no relevant change, and 12 patients (11%) showed worsening. Improvement was most frequent among patients with higher pre-transition HbA1c values: 42 of 47 patients with HbA1c >8% improved, compared with 31 of 38 patients with HbA1c 7–8% and 8 of 22 patients with HbA1c <7%. Conversely, worsening was observed predominantly in patients with lower pre-transition HbA1c values.
Patients with higher pre-transition HbA1c values showed larger absolute HbA1c reductions. Because change and response categories are defined relative to baseline, these associations are susceptible to regression to the mean and measurement error and are not quantified as treatment-effect modifiers. An association was also observed with Oldham’s method, relating change to the average of pre- and post-transition values (r=−0.36 [95% CI: −0.52 to −0.19]; p<0.001). The between-patient SD narrowed from 1.08% before to 0.81% after transition.
We did not detect significant differences in HbA1c change across the demographic and clinical baseline subgroups. Confidence intervals were wide (for example, −0.21 to +0.31 percentage points for sex), and clinically relevant differences cannot be excluded. The baseline-adjusted single-characteristic models agreed with the full ANCOVA in 19 of 20 comparisons; prior pump therapy in the full cohort was significant in the single-characteristic model (p=0.027) but not in the full model (p=0.117).
b) HbA1c and CGM-derived outcomes in the CGM subgroup (n=61)
CGM data completeness over the 14-day observation period was 85.7% ± 16.5% before transition and 87.1% ± 16.5% after transition. Pre-transition and post-transition values, as well as mean changes, are summarized in Table 4. Overall, the data indicate improved glycemic control after transition to HCLS, with reductions in HbA1c, time above range, glycemic variability, and GMI, together with an increase in TIR. TBR very low remained low and did not show a statistically significant change. Because pre-transition values were already zero in approximately two-thirds of patients, this parameter was subject to a pronounced floor effect, limiting the interpretability of further reductions. Exploratory score results are reported in Supplementary Table S2.
The distribution of HbA1c response categories was comparable to that observed in the total cohort. We did not detect significant differences in HbA1c change across the analyzed demographic and clinical baseline characteristics in this subgroup. Confidence intervals were wider still (for example, −0.12 to +0.58 percentage points for sex), so clinically relevant differences cannot be excluded.
Discussion
Principal findings
This retrospective real-world study evaluated clinical outcomes in 107 adults with type 1 diabetes following transition to one of the four HCLS available in Switzerland between 2019 and 2024. Transition to HCLS was associated with improvements in HbA1c and several CGM-derived parameters. Similar improvements in glycemic control have been reported in prospective studies during the first months after initiation of hybrid closed-loop therapy.16,19
Notably, most patients were already using diabetes technology before transition to HCLS: 98% were using CGM and 75% were receiving insulin pump therapy. The observed improvements therefore occurred largely on top of existing technology-supported diabetes management. Nevertheless, HCLS remained dependent on active patient participation, particularly for carbohydrate entry and adjustments in situations such as physical activity or illness.16,19
Among 107 patients, mean post-transition HbA1c was 7.2%, and 81 (76%) showed improvement. Improvement was observed in 42 of 47 (89%) patients with baseline HbA1c >8% and 8 of 22 (36%) with baseline HbA1c <7%. This contrast cannot establish a differential treatment effect: change scores and response categories depend on baseline measurements and are susceptible to regression to the mean and measurement error. The narrowing of the between-patient HbA1c spread and the Oldham analysis support convergence, but without an untreated comparator the contribution of HCLS to the baseline association cannot be isolated. In 14 patients (13%) HbA1c was unchanged, while 12 (11%) worsened; worsening occurred in 7 of 22 (32%) patients with baseline HbA1c <7% and 1 of 47 (2%) with baseline HbA1c >8%. Potential clinical contributors include difficulty managing carbohydrate entry or other system functions; in some patients, a lower baseline HbA1c may have come at the expense of hypoglycemia. These explanations were not tested in this study.26
The NHS England real-world HCL cohorts reported by Crabtree et al. and Liarakos et al. showed substantial HbA1c improvements in populations selected for above-target baseline HbA1c.27,28 Their results provide useful context for our cohort, but differences in eligibility, baseline glycemia and follow-up preclude a direct comparison of treatment effects.
Among patients with available CGM data, recommended CGM targets were approached on average after transition to HCLS. The observed improvements in TIR, GMI, and glycemic variability support the interpretation that HCLS improved overall metabolic control beyond HbA1c alone. In particular, TIR has been shown to correlate closely with HbA1c.15
Target values for TBR and CV were achieved on average, whereas mean TIR remained below target and mean TAR remained above target. Nevertheless, the observed changes indicate reductions in time spent in hyperglycemia and hypoglycemia as well as decreased glycemic variability under HCLS therapy. Overall, this suggests improved therapeutic safety, particularly regarding hypoglycemia risk and metabolic stability, consistent with previous HCLS studies.16,19,29,30 Growing evidence suggests that hyperglycemia, hypoglycemia, and glycemic variability may independently affect clinical outcomes in diabetes beyond HbA1c alone.2,31,32
The exploratory four-component score suggested improved combined glycemic control (Supplementary Tables S1 and S2). It is unpublished and has not been externally validated; its clinical interpretation remains uncertain.
Clinical implications and HCLS performance
Conventional insulin pump therapy has previously been shown to improve HbA1c compared with multiple daily injections.33,34 In the present study, patients with prior pump therapy showed a slightly smaller, non-significant HbA1c reduction, but still appeared to benefit from transition to HCLS, consistent with previous HCLS trials and meta-analyses.16,19,22,29
No significant differences in adjusted HbA1c outcomes were detected across the analyzed demographic or clinical baseline characteristics, including the four HCLS systems. The confidence intervals, especially in the smaller CGM subgroup, do not exclude clinically relevant differences. System selection was individualized rather than randomized, and the absence of statistical significance does not establish equivalence between systems.
HCLS are now an established treatment option for optimizing glycemic control in T1D,26 particularly with regard to reducing glucose variability and hypoglycemia. Our real-world findings are consistent with this evidence.
Safety, implementation, and future perspectives
HCLS discontinuation was uncommon: only one patient returned to previous non-pump therapy during follow-up, while all other patients continued HCLS therapy, including those with worsening HbA1c values. This may reflect careful patient selection and support by an experienced diabetes care team, as well as the high acceptance of HCLS reported in previous studies.16,19,29,30 Some patients no longer attended scheduled HbA1c assessments or diabetes consultations during follow-up. Regardless of the reason, this underscores the importance of continued medical follow-up and structured education, as therapy-related errors may occur despite improved glycemic control.
Before transition, 17 patients had experienced at least one DKA event in the period since type 1 diabetes diagnosis (mean duration 22.7 ± 11.9 years, range 1–53 years). Within up to one year after transition to HCLS, one patient experienced a DKA event. The markedly unequal observation windows and the lack of event counts and person-time prevent a before–after comparison of DKA incidence. No hospitalizations due to severe hypoglycemia were documented after transition. Follow-up was too short to assess long-term safety or diabetes-related complications.
During the study period, 20.7% (n=124) of patients with T1D treated at Institute DiaMon were transitioned to HCLS. Broader implementation may be supported by increasing clinical experience, greater familiarity with automated insulin delivery among diabetes teams, and ongoing technological development. However, barriers remain, including continuous device use, demands related to system management, and the continued need for meal announcements and carbohydrate estimation. HCLS are therefore not yet fully autonomous, particularly in situations such as physical activity or illness. Since September 2026, CamAPS Liberty has been commercially available in Switzerland as a fully closed-loop feature within the myLoop system, designed to automate insulin delivery without routine carbohydrate counting or pre-meal bolusing.35 Further development toward fully closed-loop systems with reduced user input, including automated meal detection, may address some of these limitations. Careful patient selection, structured education, and continued follow-up remain important for successful long-term use.
Limitations
Several limitations should be considered. This was a retrospective single-center study without a control group, and HCLS selection was not randomized. HbA1c assessments were performed 2–6 months after transition; complete paired CGM data were available for only 61 of 107 patients. CGM outcomes were based on a single 14-day assessment period. Although this duration is consistent with current consensus recommendations and provides reasonable estimates for several metrics, recent studies suggest that it may be insufficient for some metrics, particularly TBR and glycemic variability as measured by CV, and that longer sampling may better represent 90-day glycemic exposure and improve precision in downstream analyses.8–10 Sampling duration may therefore have limited the precision of some CGM-derived estimates in this study.
The multivariable CGM subgroup analysis had 49 residual degrees of freedom but limited precision. The association between baseline HbA1c and subsequent change is susceptible to regression to the mean and measurement error; the Oldham analysis does not establish a treatment-effect modifier in the absence of a comparator. The pre-transition DKA history covered years since diagnosis, whereas post-transition surveillance covered up to one year, so incidence rates cannot be compared. The four-component score is unpublished and unvalidated and is presented only in the supplement. These limitations restrict causal inference and generalizability.
Conclusion
In this real-world cohort of adults with type 1 diabetes, transition to HCLS was associated with improved HbA1c and CGM-derived glycemic parameters within 2 to 6 months. Larger observed reductions among patients with higher baseline HbA1c should be interpreted cautiously. Structured education, active patient participation, and continued follow-up remain essential in routine clinical practice.
Conflicts of interest
The authors have declared that the study was conducted in the absence of any commercial or financial relationships that could be construed as a potential conflict of interest.
Funding
All authors have declared that no financial support was received from any organization for the submitted work.
Ethical considerations: Consent and privacy
This retrospective analysis was based on anonymized data collected during routine clinical care. No study-related intervention was performed, and no additional patient contact was required. Patient confidentiality was protected throughout the analysis and publication process. The study was conducted in accordance with the principles of the Declaration of Helsinki.
Availability of data and materials
All patient data that support this study are included in an anonymized form in the published article.
Author contributions
All authors contributed to and approved the final manuscript.
AI use
Generative AI tools were used to support language editing and the formulation of selected text passages.